
Focus on what you really need – Here’s how you get performance insights and recommendations of your Digital Workspace environment!


Are you migrating your Desktop workloads to Azure, or any other Public Cloud – and don’t want to consume money for nothing? Continue reading, this article might be interesting for you!
“The year of the Digital Workspace and DaaS”
My personal experience says that this year isn’t the – year of VDI – were we all waited for – for ages, but the year of the Digital Workspace and Desktop-As-a-Service (DaaS), or better say all the components around the Virtual Desktop Infrastructure. Within the Digital Workspace, new components came available, such as analytics and constantly monitoring your infrastructure is key, especially for Public Cloud environments, as costs are based on performance – SKUs and different virtual machine sizings.
Sizing matters – The Public Cloud, such as Microsoft Azure, isn’t originally designed for lifting and shifting workload from on-premises private datacenters to Azure Infrastructure-As-a-Service. However, when you talk about Virtual Desktops – you always need to use IaaS for that purpose. Some legacy apps – or sometimes also called traditional apps – needs to be migrated to Azure as well, because of latency requirements. Applications and Database servers mostly need to be placed close to the Desktops.
Also, it’s no secret that we – IT Admins – previously didn’t care too much about overcommitting servers in our on-premises environment when we had the resources available for that. As a sort of extra confident insurance to guarantee the performance. Now in a Public Cloud point of view, this immediately reflects your OpEx monthly billing costs – and for this reason, you’ll need to make sure that you size your Virtual Machine in the most agile way possible, to have the most cost-effective environment available. Now we come to the point where ControlUP analytics can make a real difference…
ControlUp Insights is an innovative SaaS web-based operational intelligence solution for monitoring and analysis of enterprise network environments. It features historical reports that allow for investigating the historical behavior of performance counters and other system information gathered by ControlUp Real-time.
Focus on what you need to know to make sure your IT infrastructure is at its best – Our friends from ControlUP did another bang-up job with releasing ControlUp Insights – including tons of new monitoring capabilities. Insights is a real-time analytics solution which can easily find issues within an environment, especially virtualized environments can be a challenge. It’s a SaaS solution and completely web-based, so no additional infrastructure investment has to be made in your environment. And if you’re an existing ControlUP customer, you can use it straightway with the real-time monitoring integration!
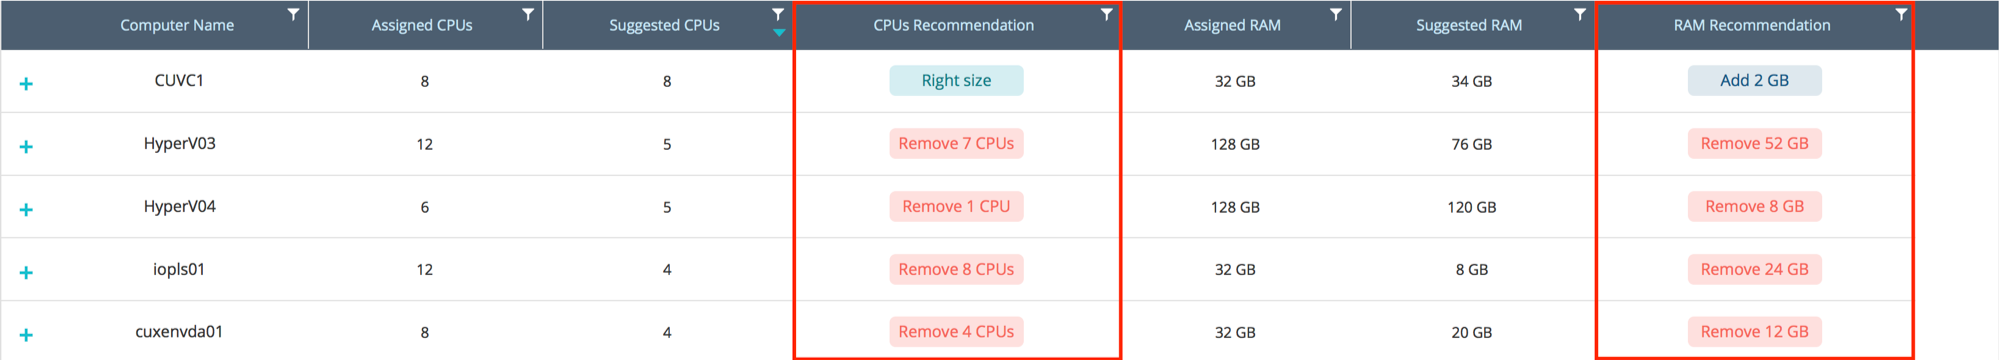
The most impressive feature of ControlUP Insights is one to solve the problem I mentioned earlier in this article, which is named – Sizing Recommendations. This feature helps you optimize resource allocations among monitored servers and desktops. It provides recommendations for optimizing the CPU and RAM allocations of each computer, which can be very beneficial for Cloud based environment.
See below an insights view of the Sizing Recommendations dashboard, where the Unutilized part tells you by intelligent machine learning background tasks what your savings can be…
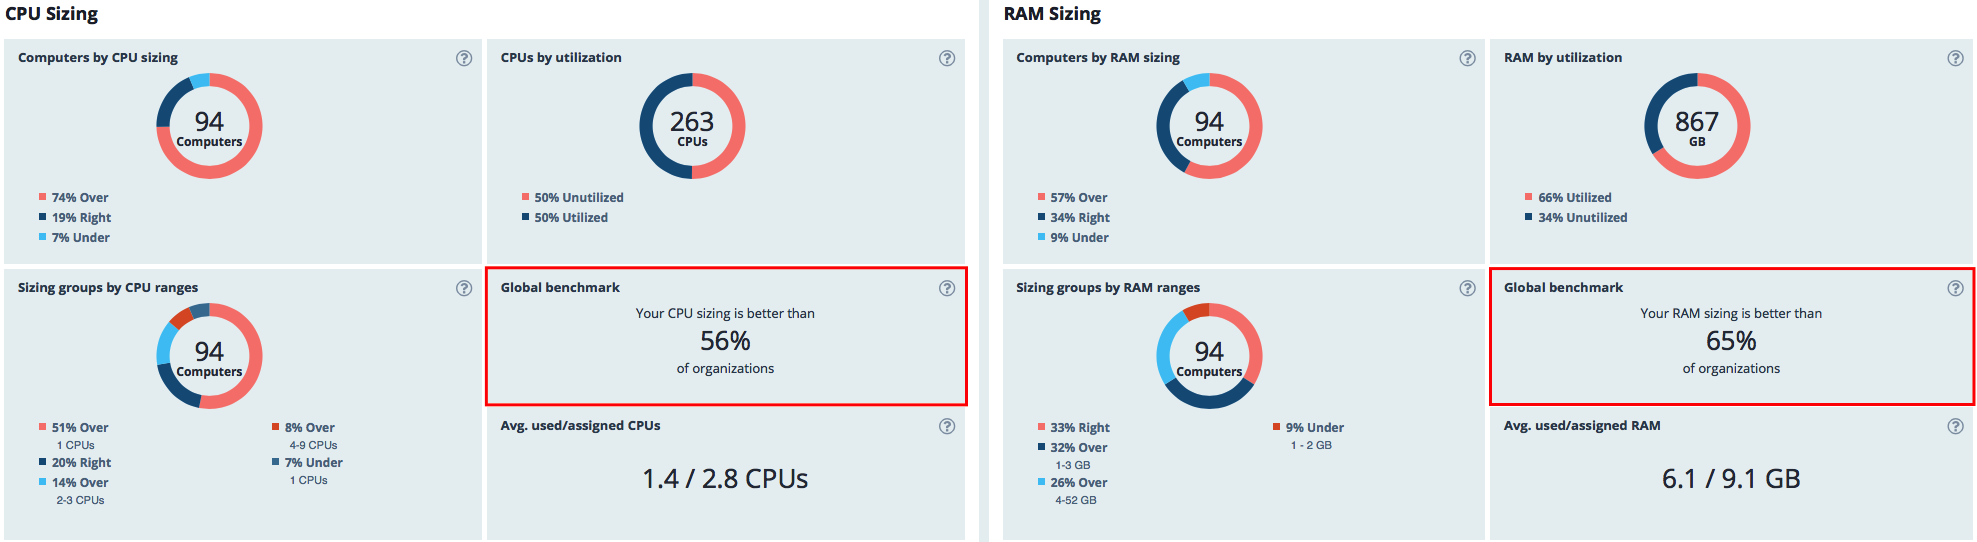
Some of the questions you get answered real-time within this solution are – What is the best allocation of the available CPU cores and RAM among the organization’s computers, does computer X have sufficient resources available to run its workload and are there computers in the system that can perform their required functions with a single CPU core after running for one week in your production environment?
In this article, I’ll walk you through the latest and greatest features of ControlUP Insights. Where you can find things, and how they can help you to get better insights and recommendations of your Virtual Desktop environment.
Enjoy reading!
Table of Contents
Click on the title to jump forward in the article:
- Analytics Dashboard – One Single Pane of Glass
- Request a free trial of the product
- How to use ControlUP Insights – Impression Video
More information about ControlUP insights
- ControlUp helps IT administrators know when it is time to move workloads out to the cloud and when they should be brought back in again. It works with applications that are run on physical Windows servers, in virtual machines or in private, public or hybrid clouds
- As ControlUp Insights chalks up more reports and functionalities, the historical reporting and analytics platform keeps improving, growing and evolving, providing more value as time goes by.
- ControlUP Insights requires the ControlUP real-time product to gather all the metrics
- ControlUP Insights is a SaaS offering that provides collective analytics, interactive historical reports, and control of hybrid cloud applications.
- Accessible using the URL https://insights.controlup.com or by using the “ControlUp Insights” button in the Home ribbon of the ControlUp Real-time console.
- License based on the retention period of the data. Currently, there are three tiers: Pro tier – which allows, 1 day of data retention, Enterprise – which allows, 1 Month of data retention, and Platinum – which allows 1 year of data retention.
- The Collective analytics feature provides IT administrators with the ability to compare their performance, availability and asset utilization with thousands of similar IT infrastructures to guide them in setting goals and expectations, making purchasing decisions and knowing that operations are running optimally.
- You can easily share ControlUp Insights reports and schedule them to be sent out to a manager, a colleague or a customer at regular predetermined times. The recipient doesn’t need to have a ControlUp Insights user account, but the email will also include a direct link to the predefined insights report.
- Now any report of your choice can be exported as a PDF file – simply click on Export on the top right-hand corner and select PDF. This makes sharing reports that much easier.
- Application Statistics report which will give you interesting information about the version variances within your organization, most popular application, top consuming applications and more.
- ControlUp Insights reports drill down makes for powerful troubleshooting analytics capabilities. With the drill down you can easily maintain the context while trying to understand the root cause of an issue.
Note: Please check out this public support portal of ControlUP for follow-up questions/answers.
Analytics Dashboard – One Single Pane of Glass
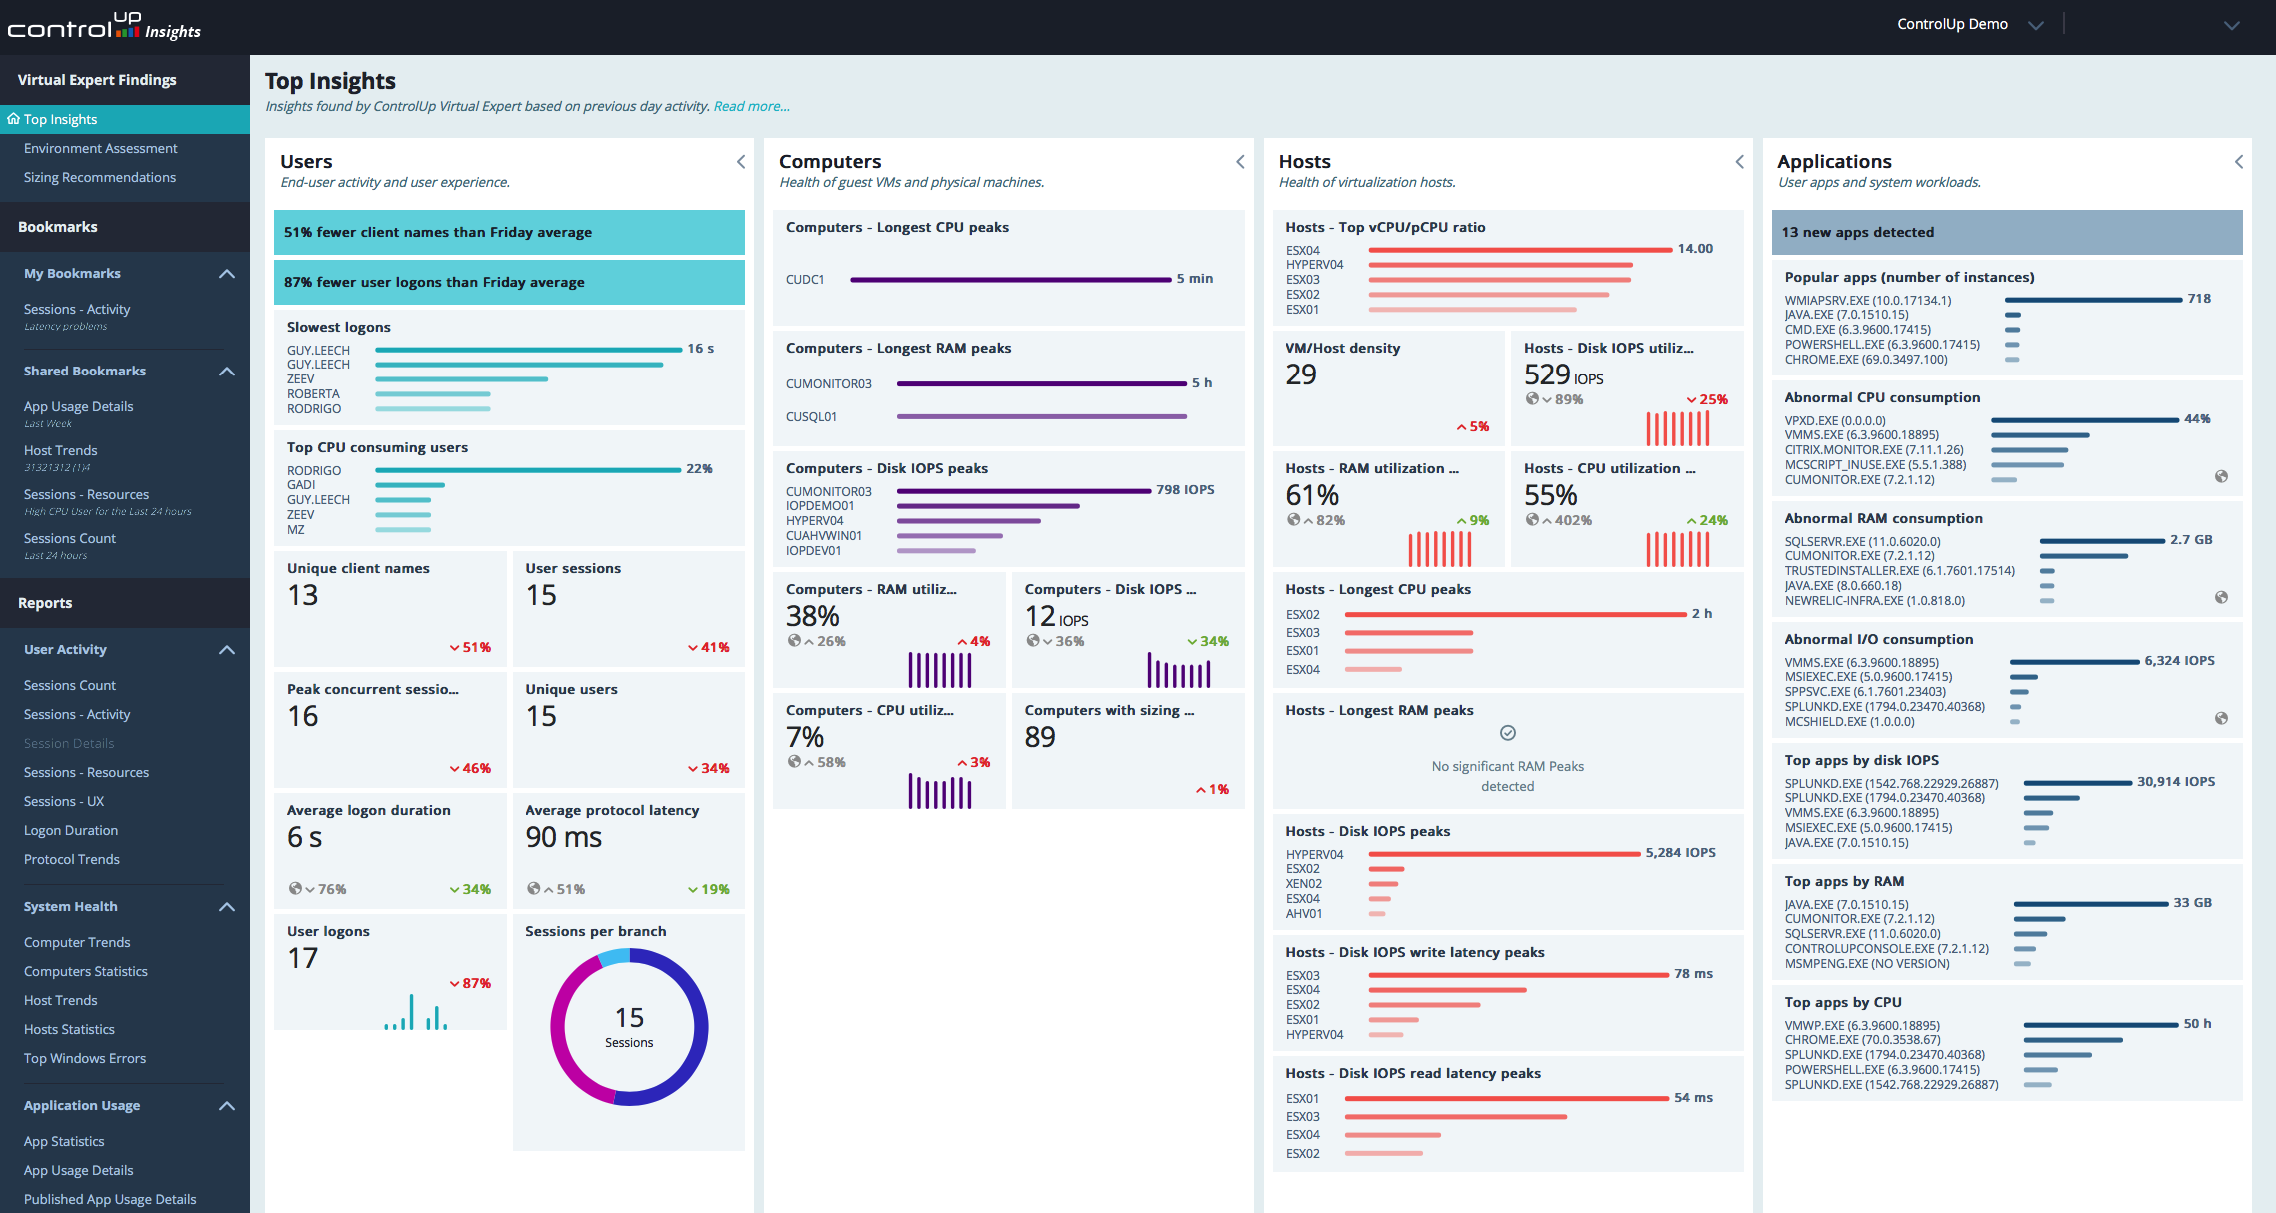
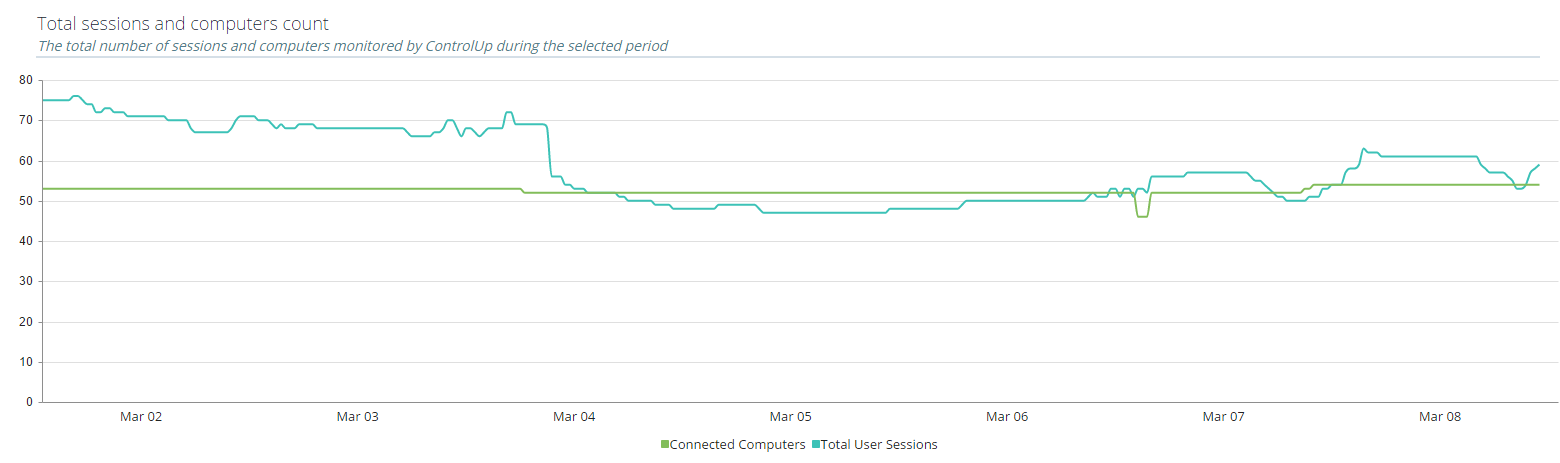
Through a tiled view, ControlUp summarizes key metrics of the state of your monitored resources every 24 hours, highlighting key activity indicators, risk factors and performance stats. The “Top Insights” page is intended to summarize the key findings regarding the state of your monitored resources by means of showing information tiles we’ll call insights. The insights shown in this page are powered by a nightly search that scans all the activity recorded by ControlUp in your environment during the previous day.
It gives you a clear and fast overview of your environment and answers the following questions:
- On which server is there a critical free disk space problem?
- How many users were active yesterday?
- How is the daily session count different compared to the normal weekly trend?
- Were there any new applications running on the monitored computers?
- What were the top CPU consuming applications and users?
Environment Assessment
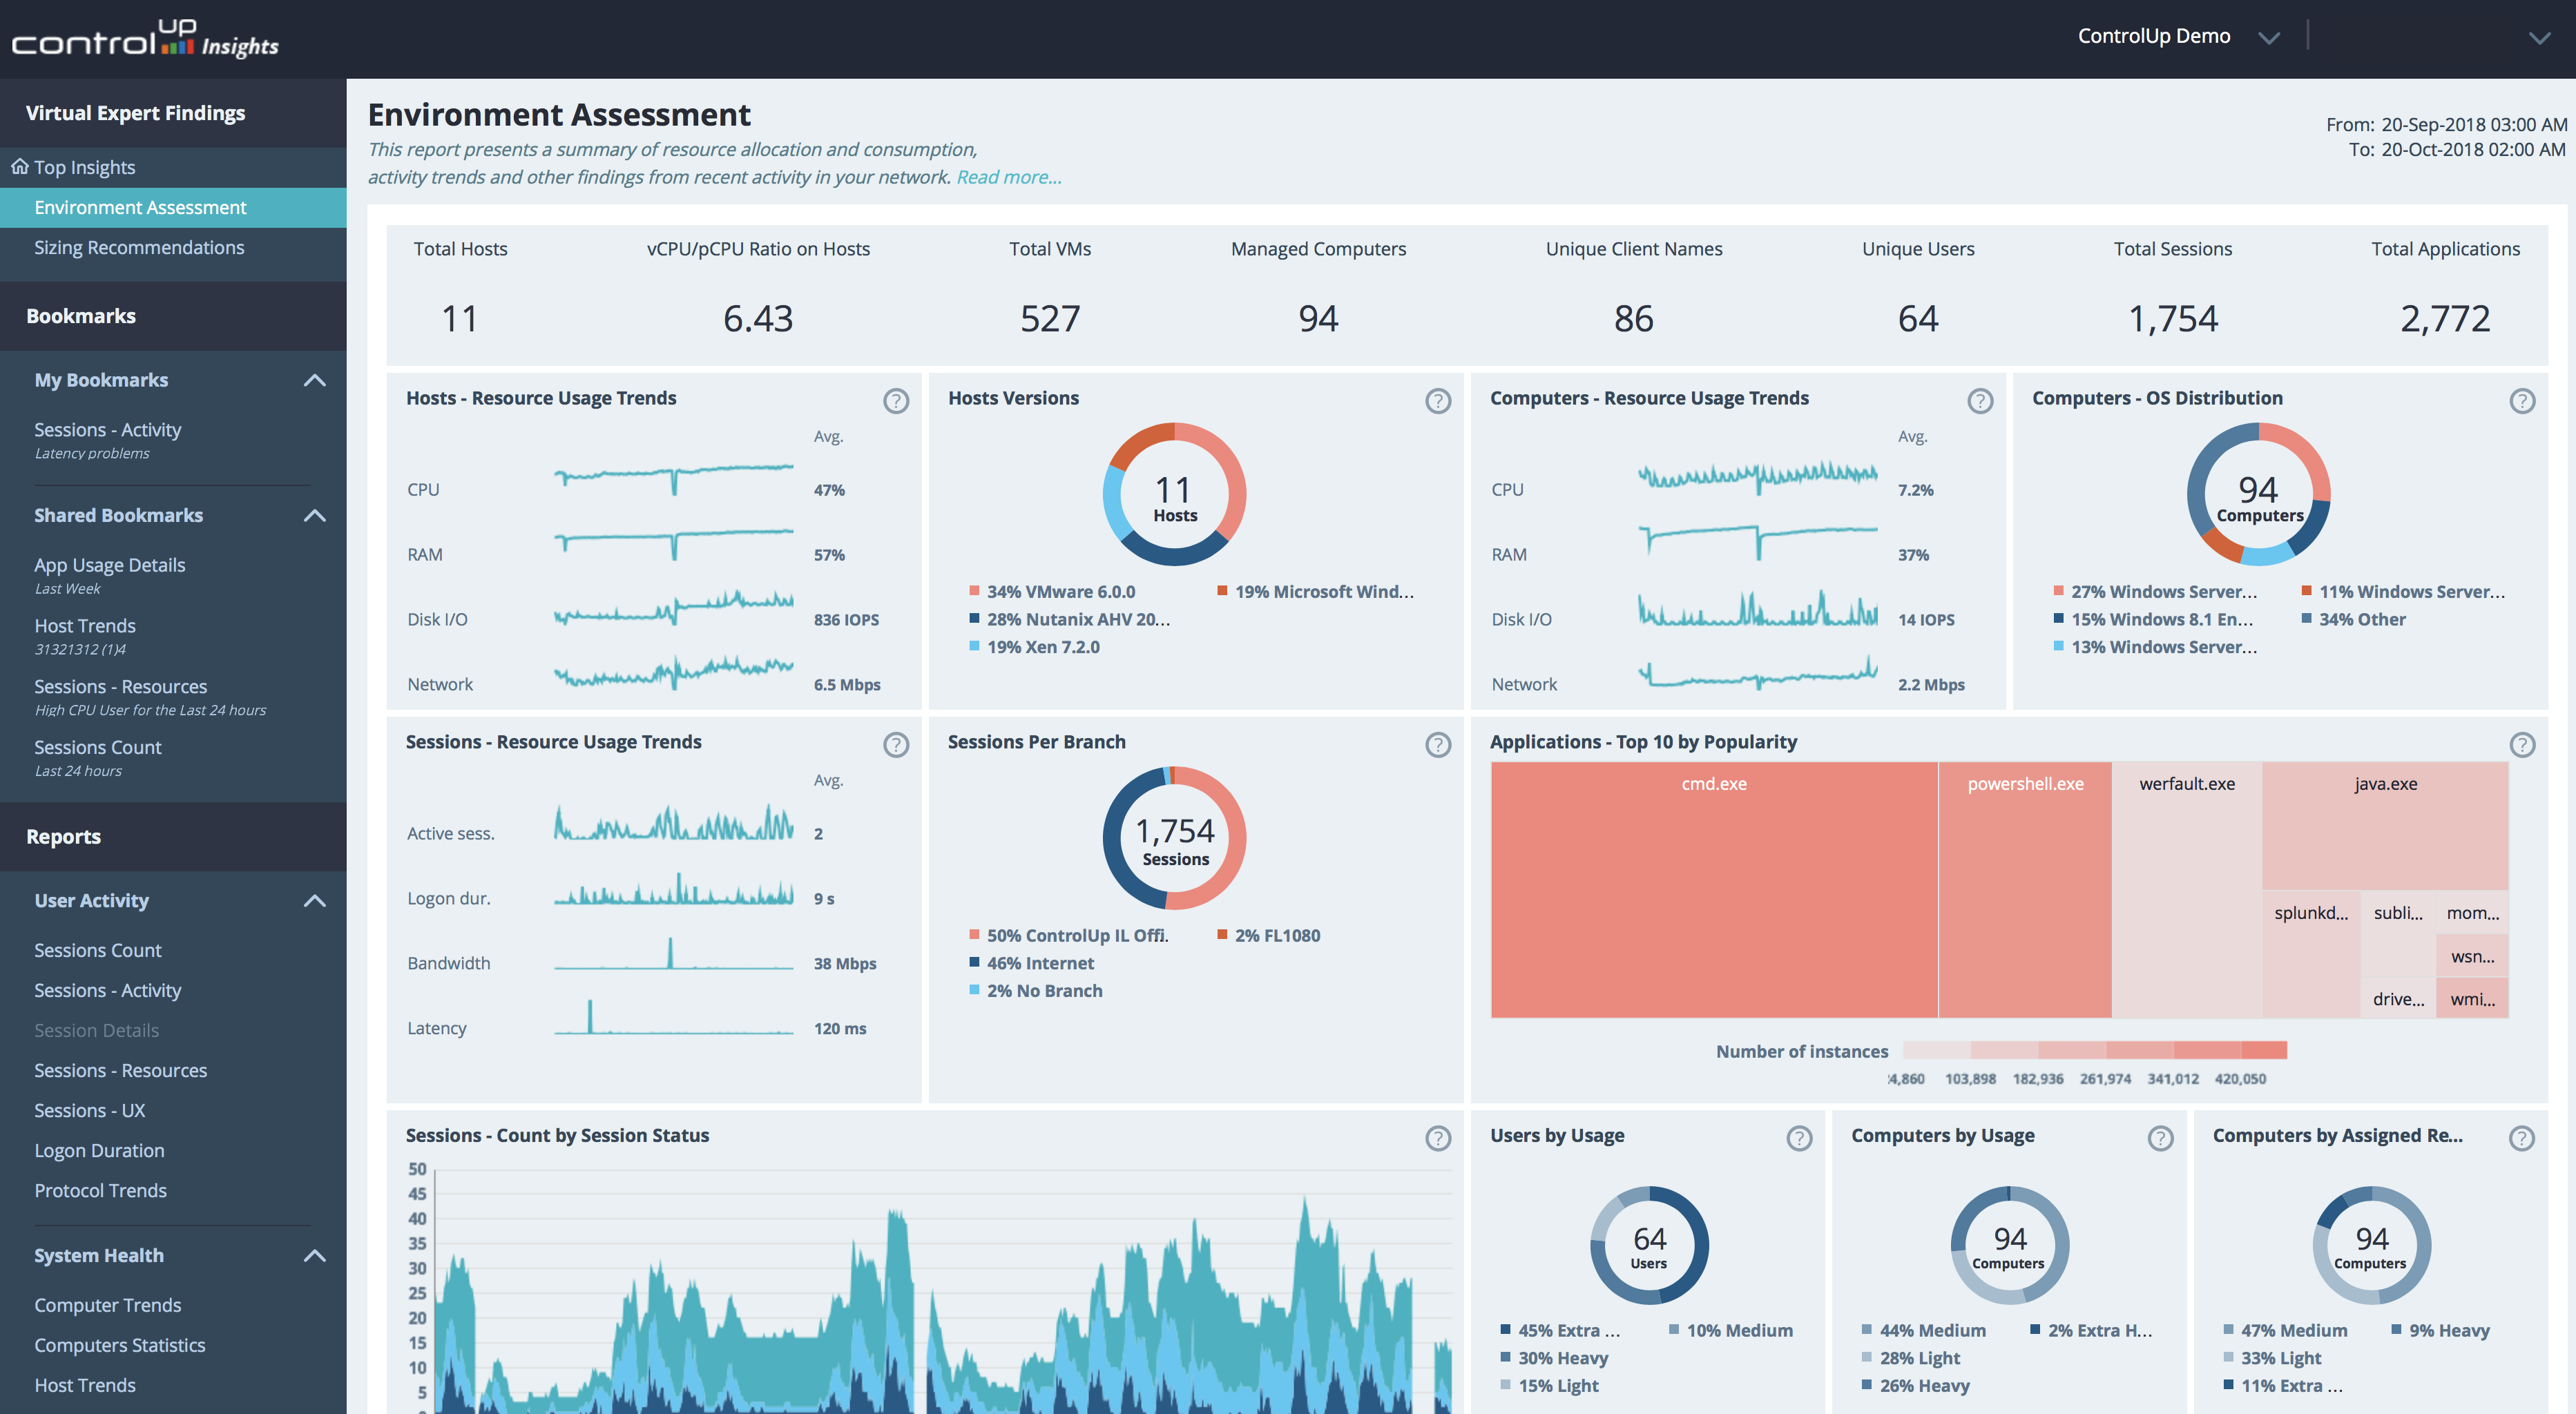
The objective of the Environment Assessment report is to aid administrators in monitoring resource usage in their organizations so that they can optimize resource allocations and identify problematic usage trends. The report presents aggregate data about resource allocation and consumption, activity trends, and other findings over the month preceding the report, updated to the minute at which the report was generated.
This report brings together data that is available in different forms in other Insights reports, presenting it in ways that give the administrator a broader understanding of how these separate pieces of information relate to one another. Many items in the report contain links to other Insights reports that provide additional details about them.
Examples of questions this report is designed to answer are:
- Are the physical CPUs (pCPUs) allocated optimally among the virtual CPUs (vCPUs) in the organization?
- Which host software is in use on the host machines in the organization?
- Which operating systems are in use on the client machines in the organization?
- How long do typical sessions last?
- Which applications are used most by users in the organization?
- Which users use the most resources?
- Has there been any abnormal resource usage in the past month? Data included in this report is only from those computers on which the ControlUp Agent is installed and running.
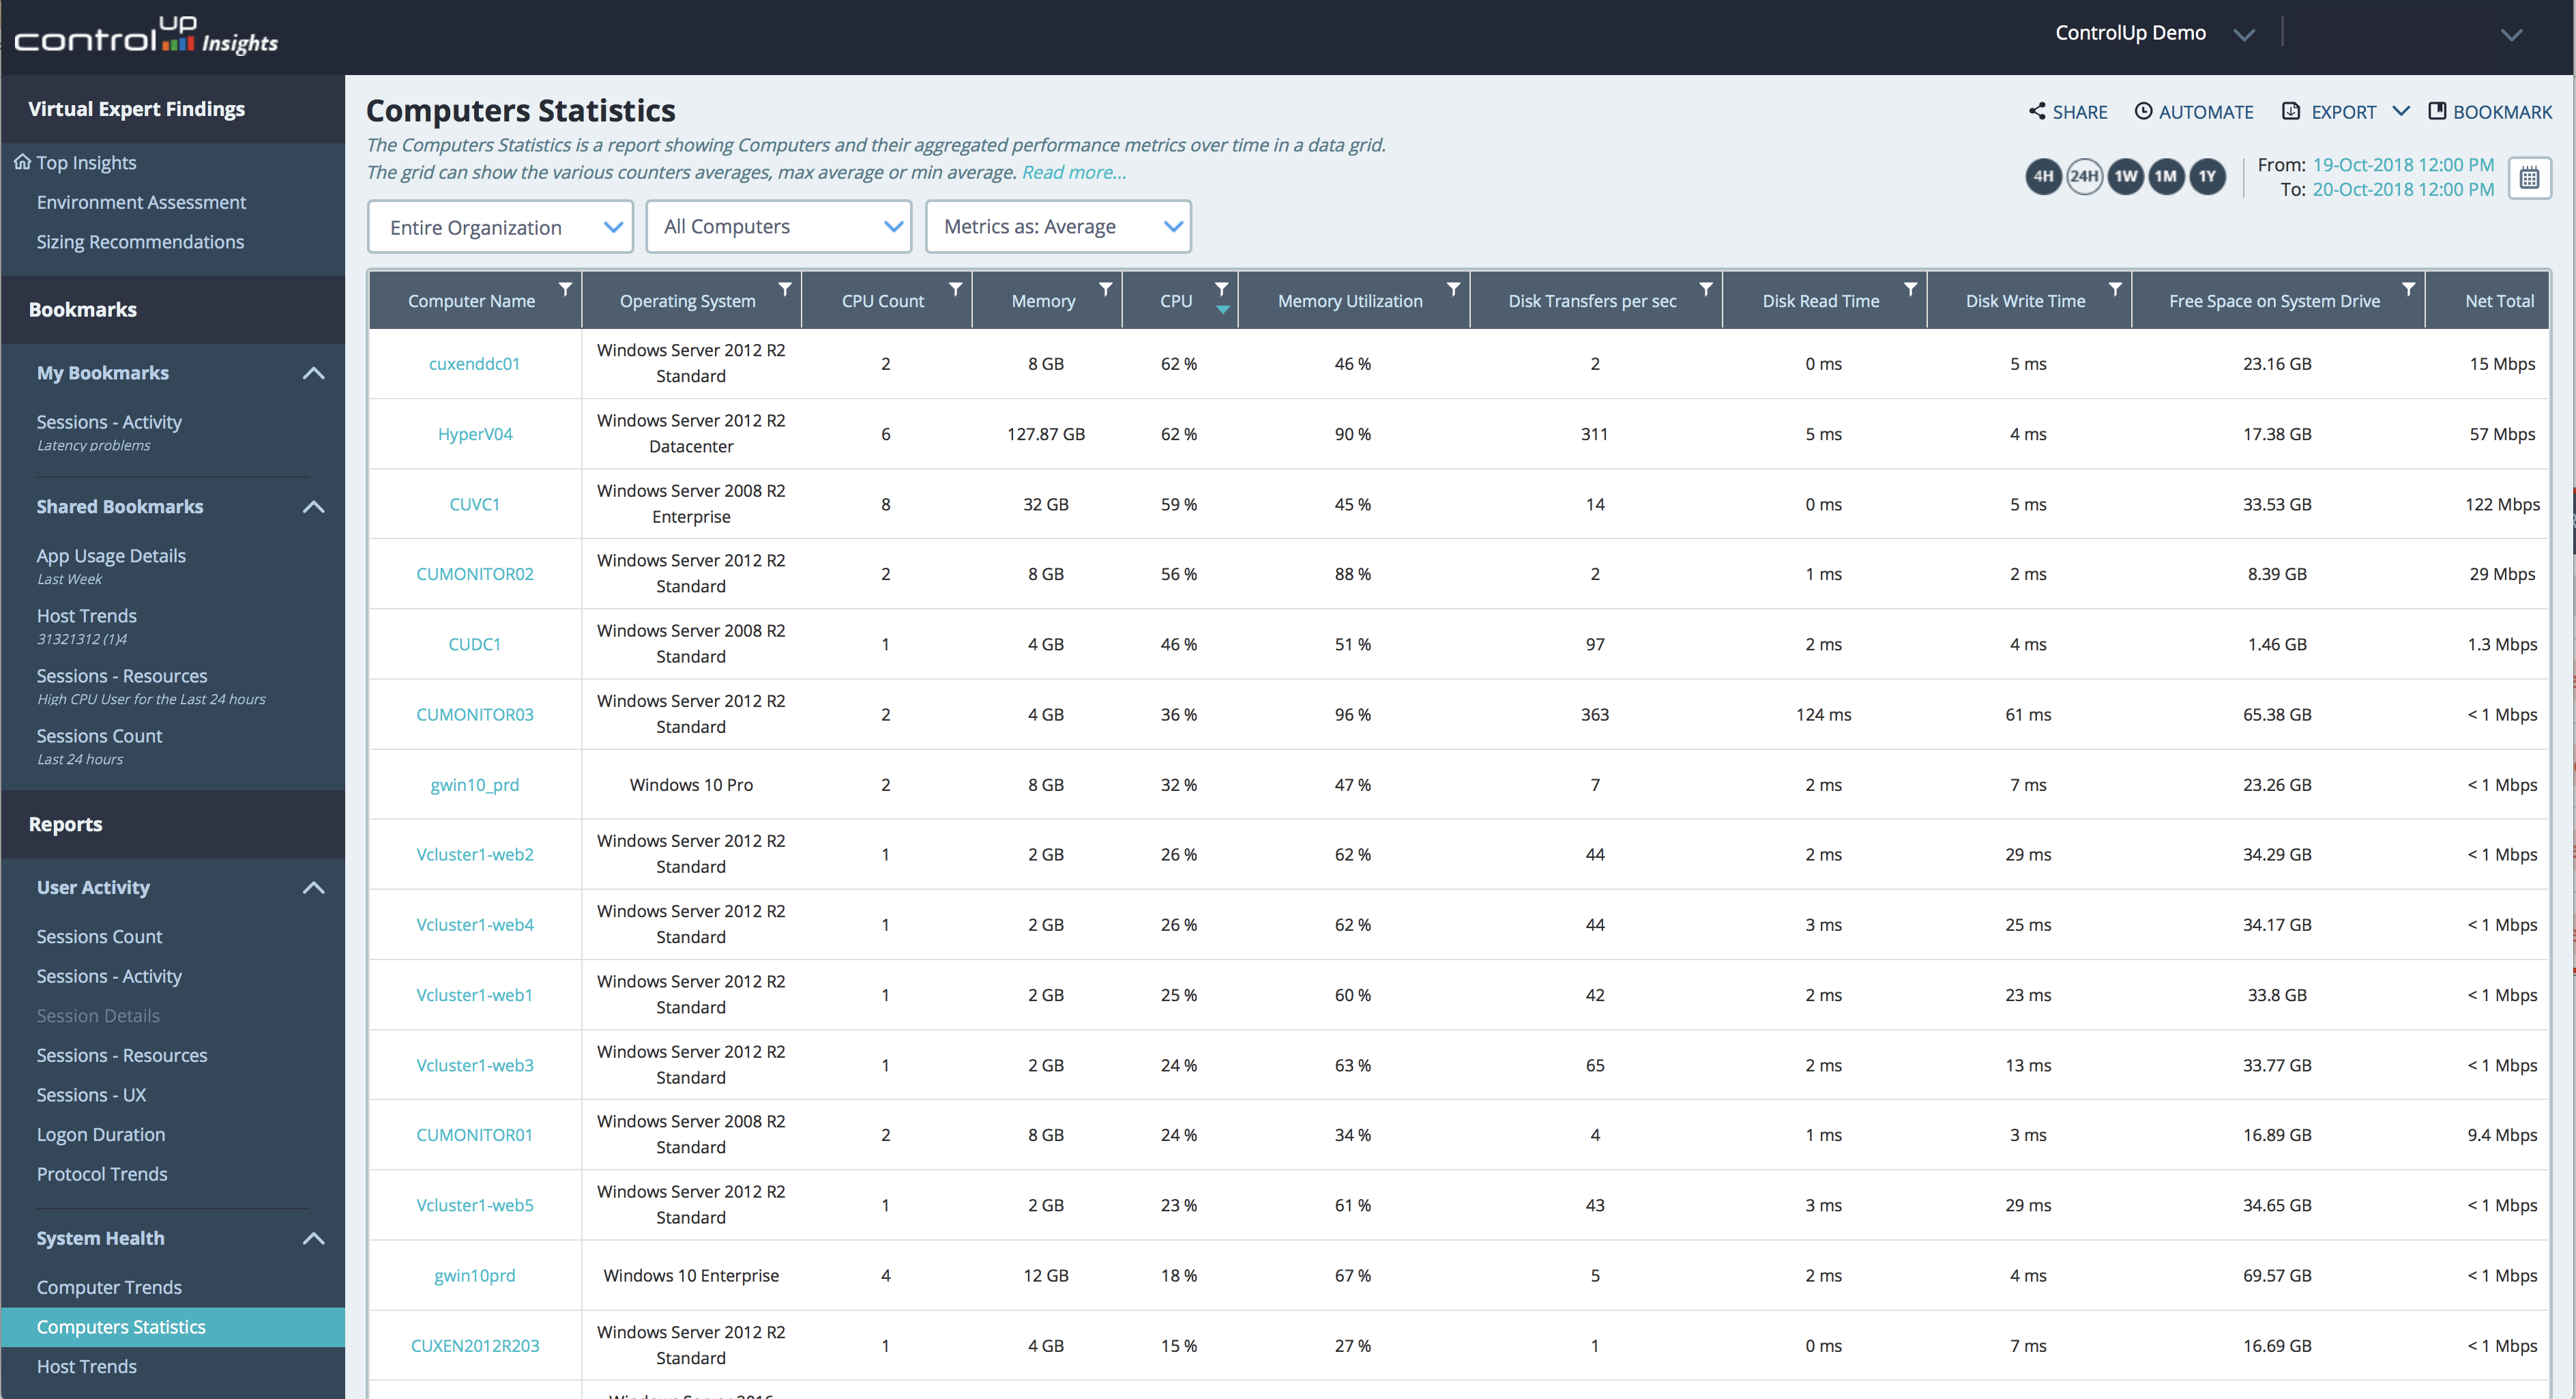
Systems Health Insights
Trend host performance metrics and resource consumption for monitored hosts by summarizing performance metrics per computer for a period of time.
- What was the average CPU utilization in the vSphere cluster this morning?
- What was the peak I/O utilization of HOST05 yesterday?
- Which VM was accountable for irregular RAM consumption on one of the hosts?
- Which hosts have the highest CPU consumption?
- Which hosts have the highest disk read/write latency?
Windows Operating System Insights
See the most frequent Windows errors recorded in your datacenter and how these errors are distributed throughout the month. Check how common these errors in other organization data centers and search for available solutions.

Insights on User Experience
Logon speed, application performance, and virtual desktop responsiveness greatly impact a user’s overall IT experience. ControlUp Insights not only provides accurate and granular data for the past 12 months, but it also compares your organization’s performance metrics against that of ControlUp’s global community over thousands of other organizations with similar environments.
- How fast is the logon process in my network perform compared to the global average?
- Which phase of the logon process accounts for the largest share of the total logon duration?
- How was the CPU affected by the user’s launching a business application at 4:45 PM?
- Can slowness reported by the user around 9:00 AM be attributed to a resource bottleneck caused by the user’s applications or to other activities on the same server?
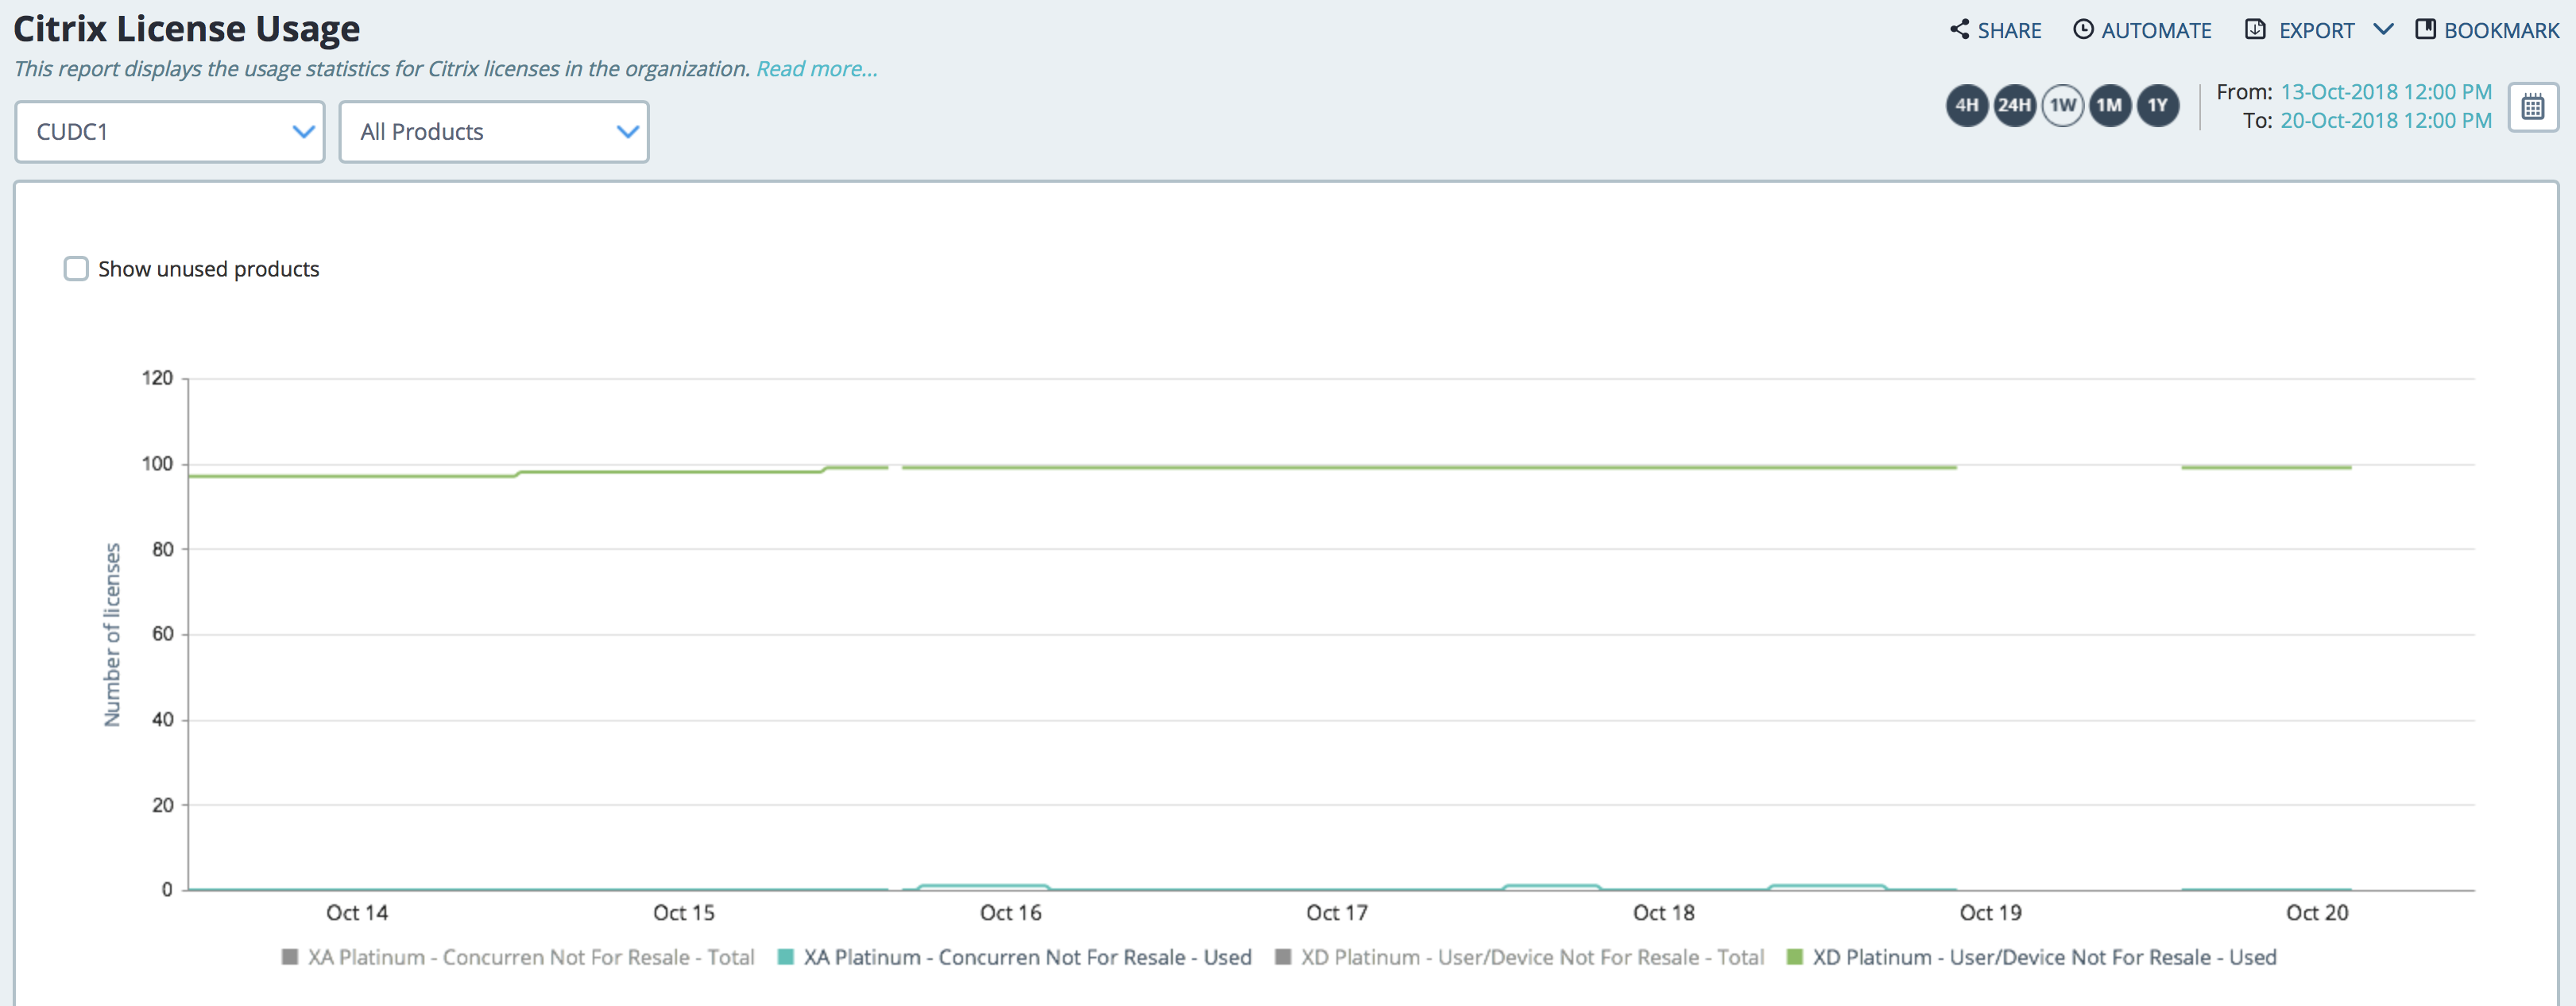
Citrix License Insights
The objective of this report is to allow the administrator to analyze Citrix license utilization over time.
This report will answer questions such as:
- What was the peak license utilization for XenDesktop during the last month?
- Licenses for which products are underutilized?
- Do more licenses need to be purchased for any Citrix products?
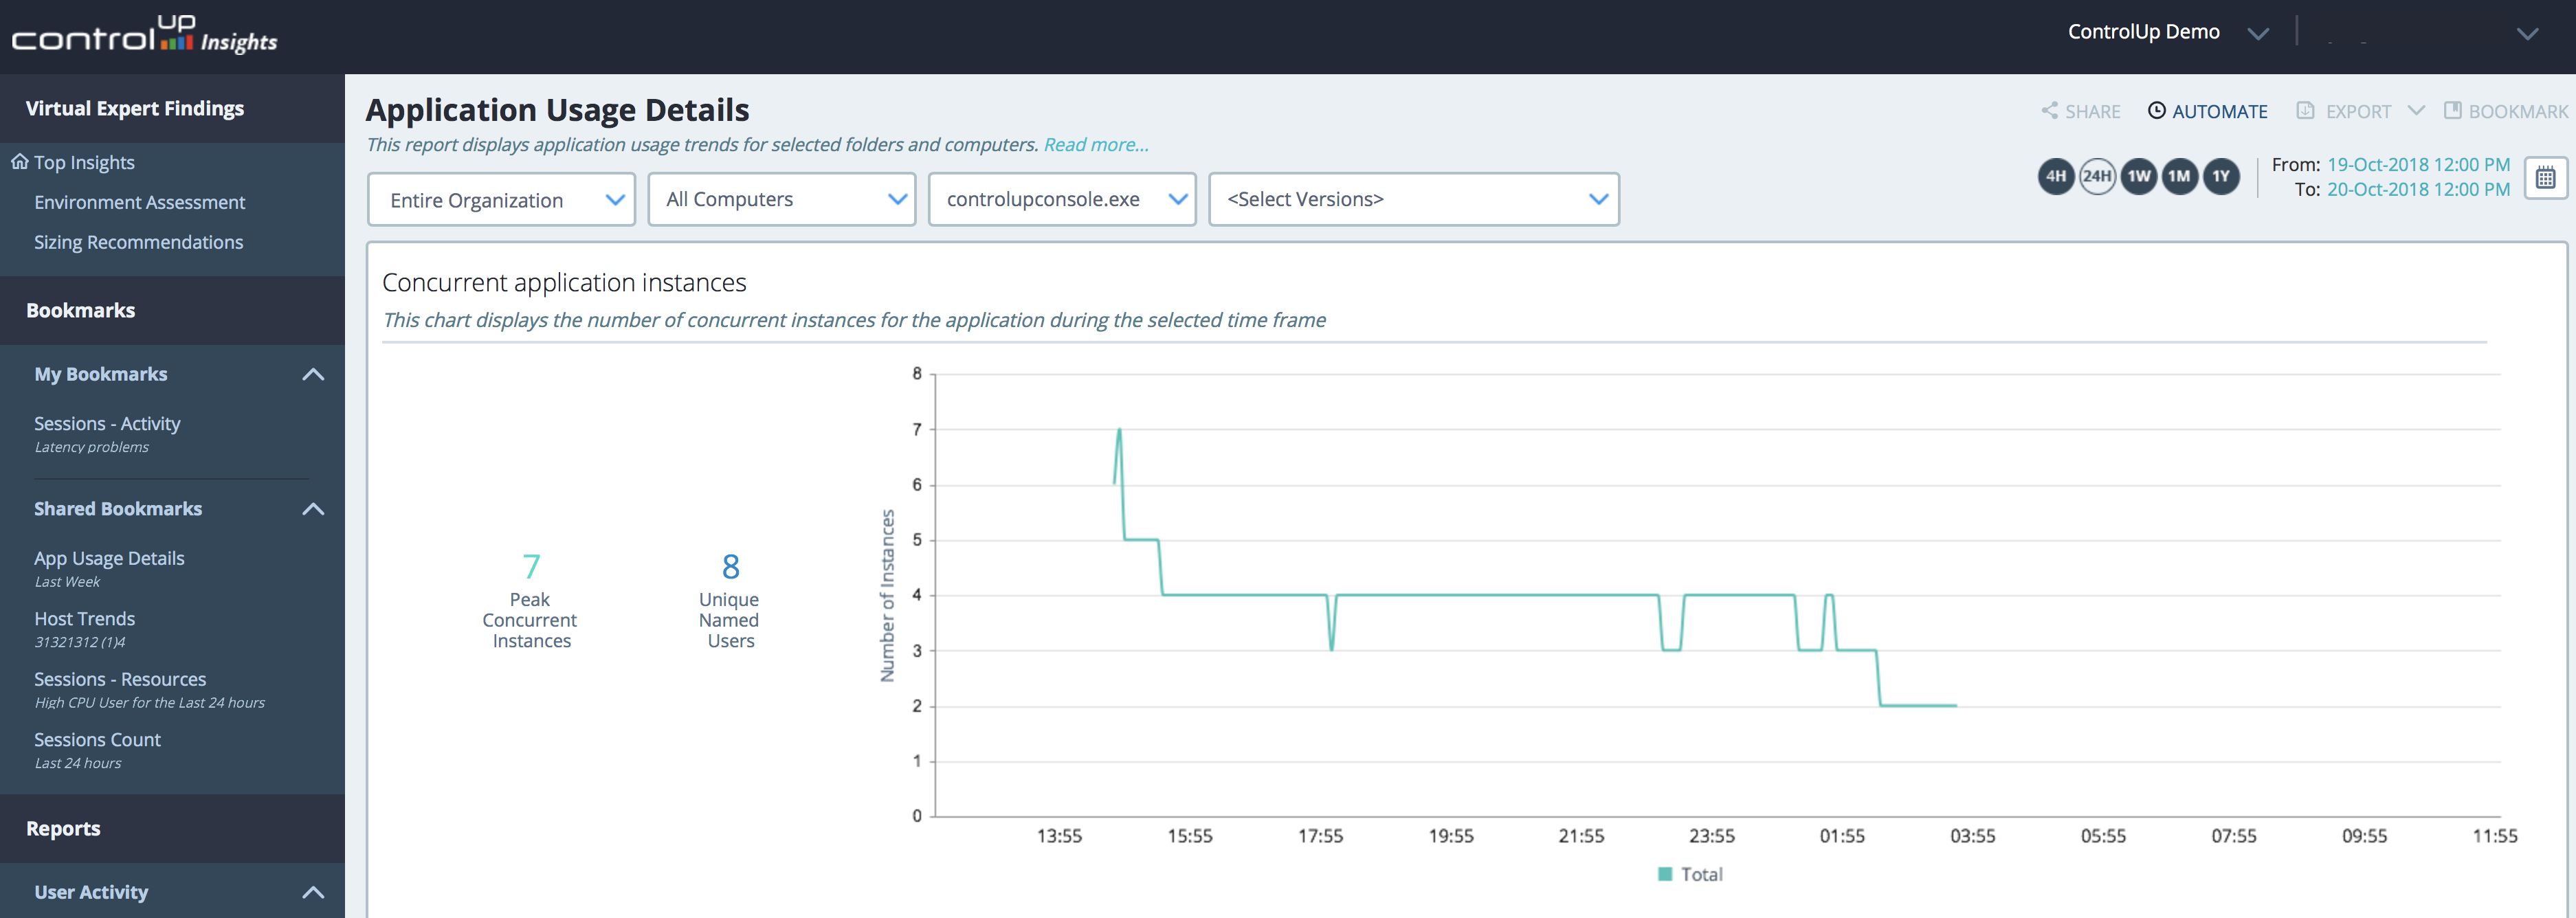
Insights on Application Usage
Zoom-in and analyze each application in your data center for its use and resource consumption, answering questions such as.
- How many concurrent instances of an application were there in my organization and what were their peak times?
- Can we save on application licenses?
- Which applications consumed the most resources, and when?
- Are there resource usage differences between different versions of the same application?
- How are your applications resource consumptions is compared to the same applications in other data centers?
Register for a free trial
Go to the following URL and click on – Download Free Trial – to download your free demo!
https://www.controlup.com/products/controlup-insights/
Note: ControlUP Insights requires the ControlUP real-time product to gather all the metrics

See for yourself – ControlUP Insights – Impression Video
Click below to see how the ControlUP Insights Dashboard looks like. It is very simple to configure and easy to manage.
Are you in the middle of a Virtual Desktop implementation, on-premises or in the Public Cloud? I recommend you to use this tool, it’s great technology – and the savings can make a real difference in your environment!
Please let me know what you think in the comment section of this article.
Thanks for reading.
Cheers,
Christiaan Brinkhoff