
Monitor your Citrix ADC – NetScalers with the ControlUp NetScaler – Monitor software


As being a Sr. Workspace Consultant for Detron in the Netherlands, I constantly search for great tools to make my work easier to do. One of the new products that attracted my interest is the ControlUp NetScaler Monitoring software. The new FREE available – hot off the press product – from our friends of ControlUp.
With the NetScaler Monitor, ControlUp provides an great simplified dashboard, with the ability to see all the most common real-time statistics of all the NetScaler devices in your environment. It shows great inside information about current ICA sessions and load balancing traffic as well. All without any license or other annual subscriptions costs. In my opinion one great tool for NetScaler admins to remember, for example; to display on a display monitor in your IT department, Administrators or Helpdesk employees can do a quick analyse/review if current problems are related to the NetScaler or something else!
This article will cover the benefits, tips and installation and configuration steps of this new ControlUp product. I encourage you to take a look at it and try it out!
Note: The software is still in beta phase, the engineering team is still working on feature enhancements. Please report any issues, feedback or ideas directly to the ControlUp engineering team here, or just leave a comment at the end of this blog!
The software facts list…
- A nice dashboard view, to see the NetScaler and all of its components metrics in real time, in one point of view.
- The ability to manage the gateways, load balancers, HDX sessions and more.
- A great and logical tree-view to drill down into objects to discover underlying data.
- You can install the software on any computer or server in your network.
- All types and versions of NetScalers, whatever it’s a VPX or MPX, are supported.
- The software is web-based, no client software is required to launch the application.
- It is free to use for everyone, can save a lot of costs on expensive monitoring tooling.
- It is very simple and easy to implement, see the following steps of this blog that will cover installation and configuration…
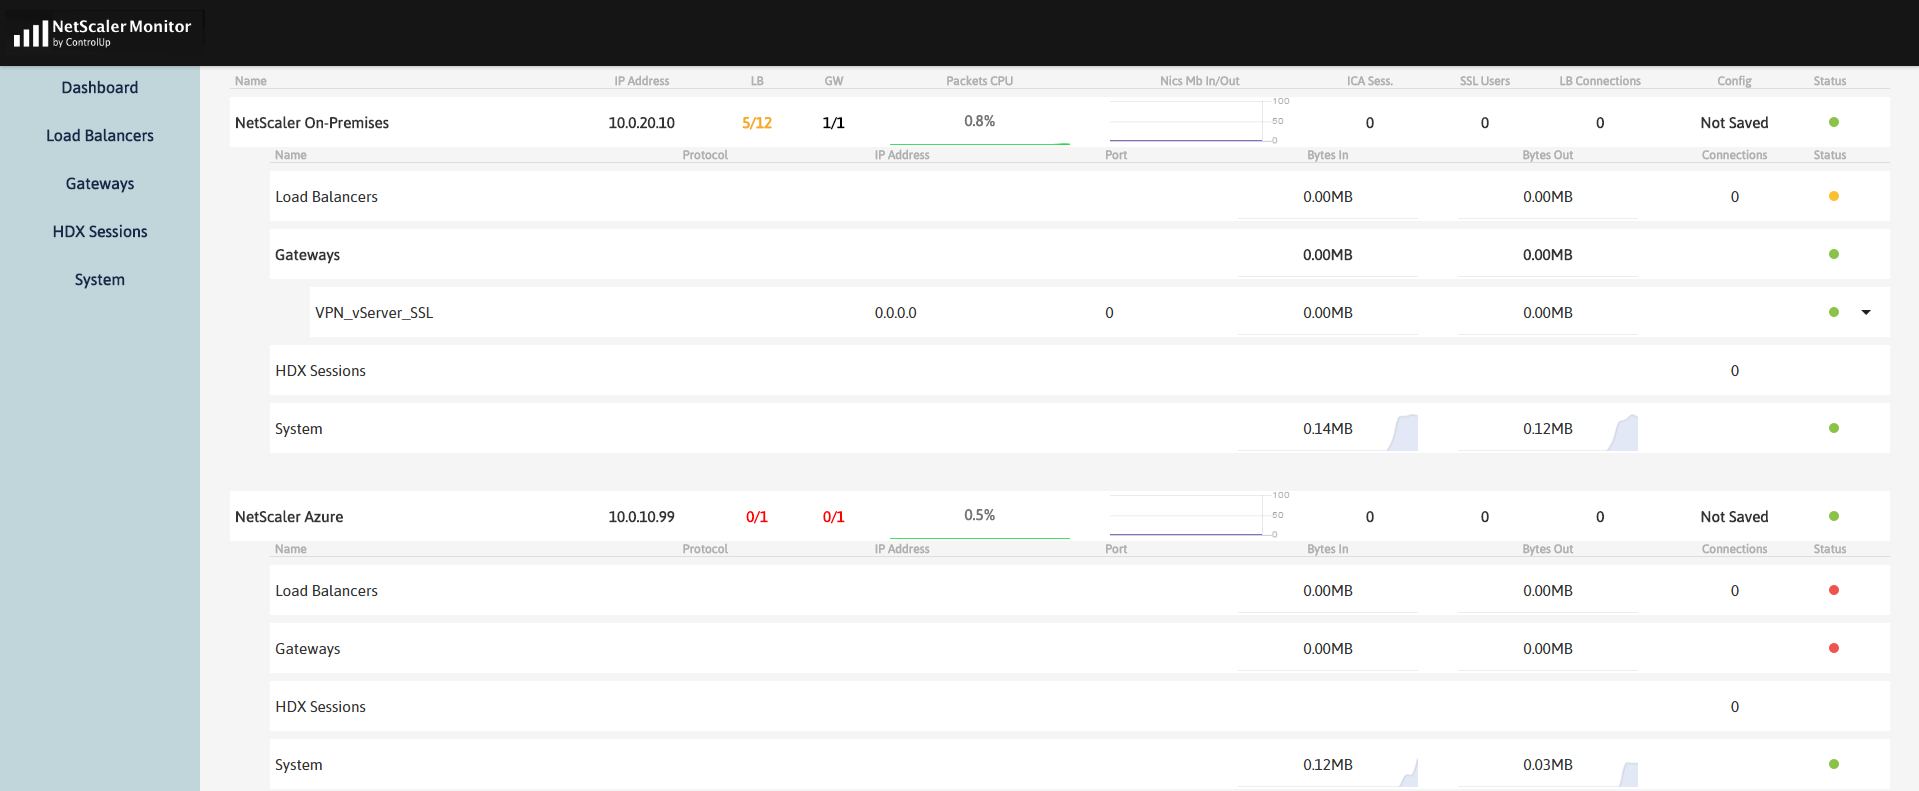
The Dashboard
The dashboard front-page shows all important information about the NetScalers. In the first view you can check the; CPU usage and Network utilization traffic per device, how many Citrix ICA sessions and/or LB sessions are connected and more. Very useful to project to a monitor display to see if performance degradation is related to the NetScaler.
The Dashboard is very simplified, see the below screenshot to get an impression:
Install the NetScaler Monitor Software
Install the software on a Desktop or Management server in your network, the server needs to have access to the NetScaler Management network / SNIP IP Address need to be reachable to read out the information.
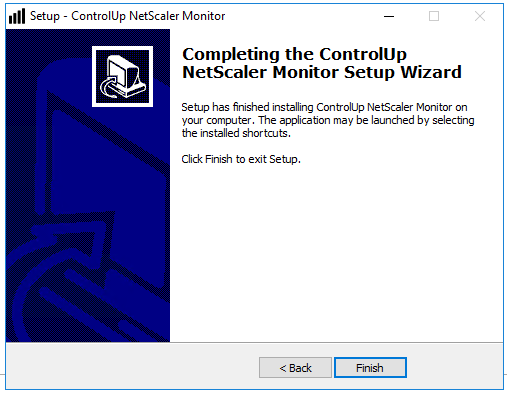
Step 1: Register (free) on this page, to get the download link to receive the latest NetScaler Monitor software version. Launch the ControlUp NetScaler Monitor.exe

Step 2: Run the install wizard follow the step by step instructions, click on Finish
Add your NetScaler Devices
Step 3: Open an Internet browser, for example IE or Chrome and go to -> http://localhost:3333
Note: Opening from other locations? Replace Localhost for the network address of the server or create a DNS A record to make it more simplified.
Step 4: Click on the Settings menu option

Step 5: Click on the + icon

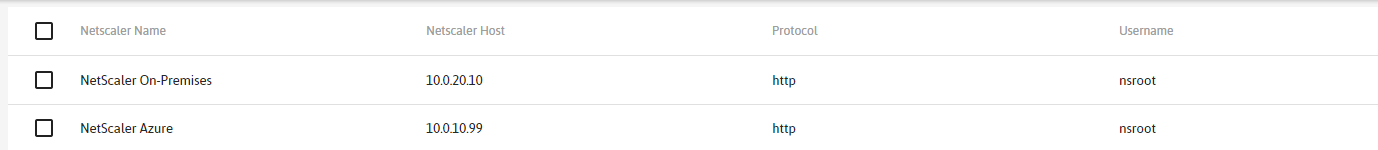
Step 6: Add all your NetScalers, first a random name, then the NSIP (management) IP of your NetScaler, the admin/sysadmin credentials and protocol. click on Add NetScaler when finished
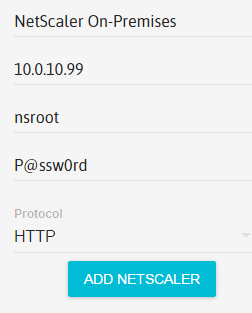
The NetScaler(s) will now be added to the Settings list
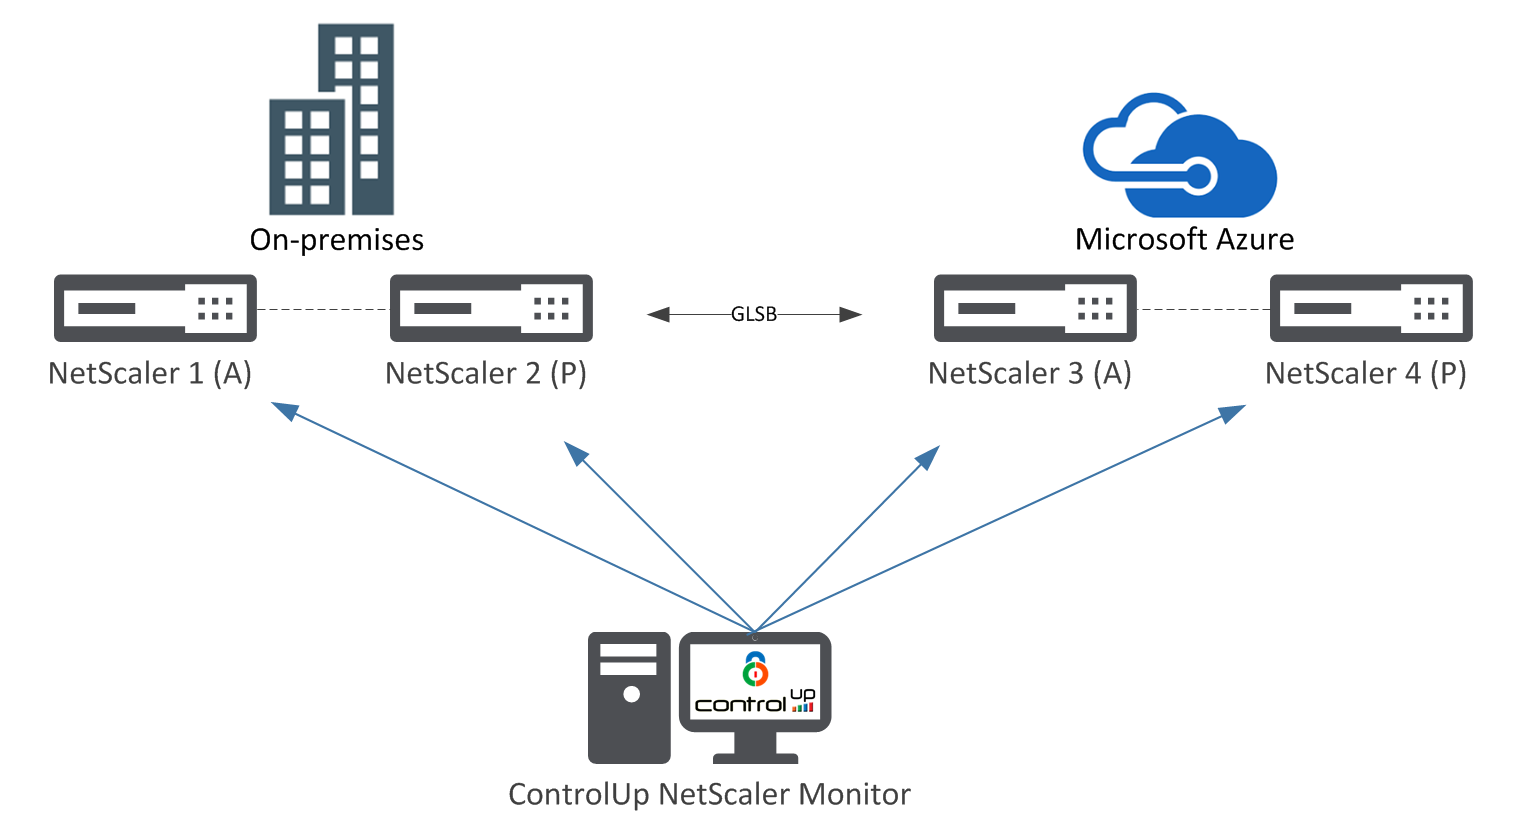
Note: When you connect from an on-premises server to Azure, an ExpressRoute, NetScaler SD-WAN or IPsec VPN tunnel is required. As alternative, install the NetScaler Monitoring software on a server in Azure that can interact with the NetScaler SNIP – Management vNet.
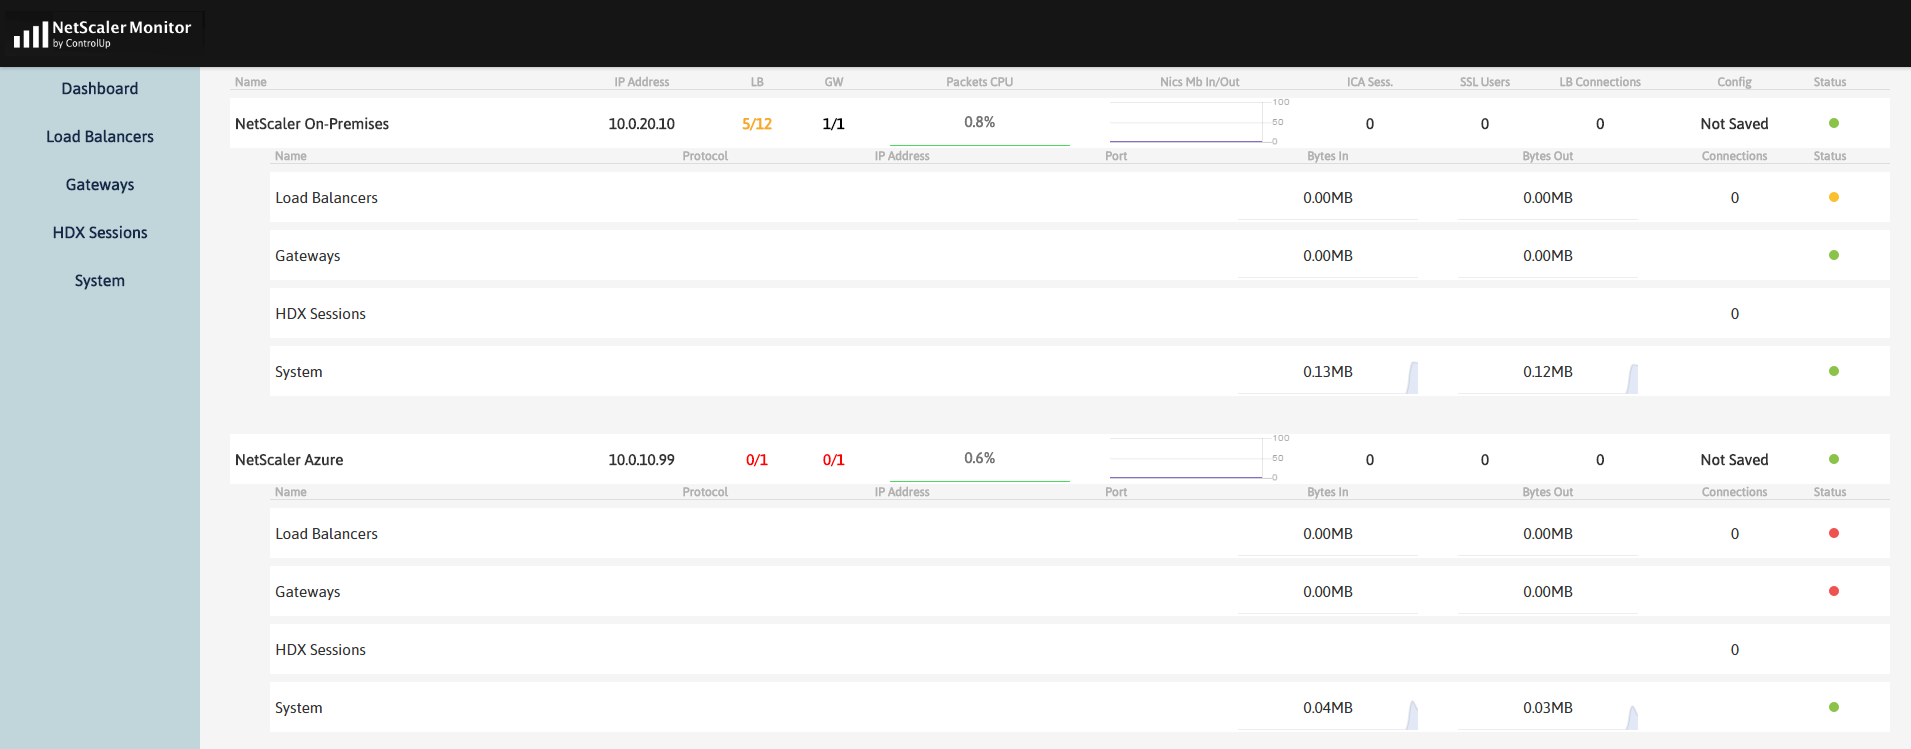
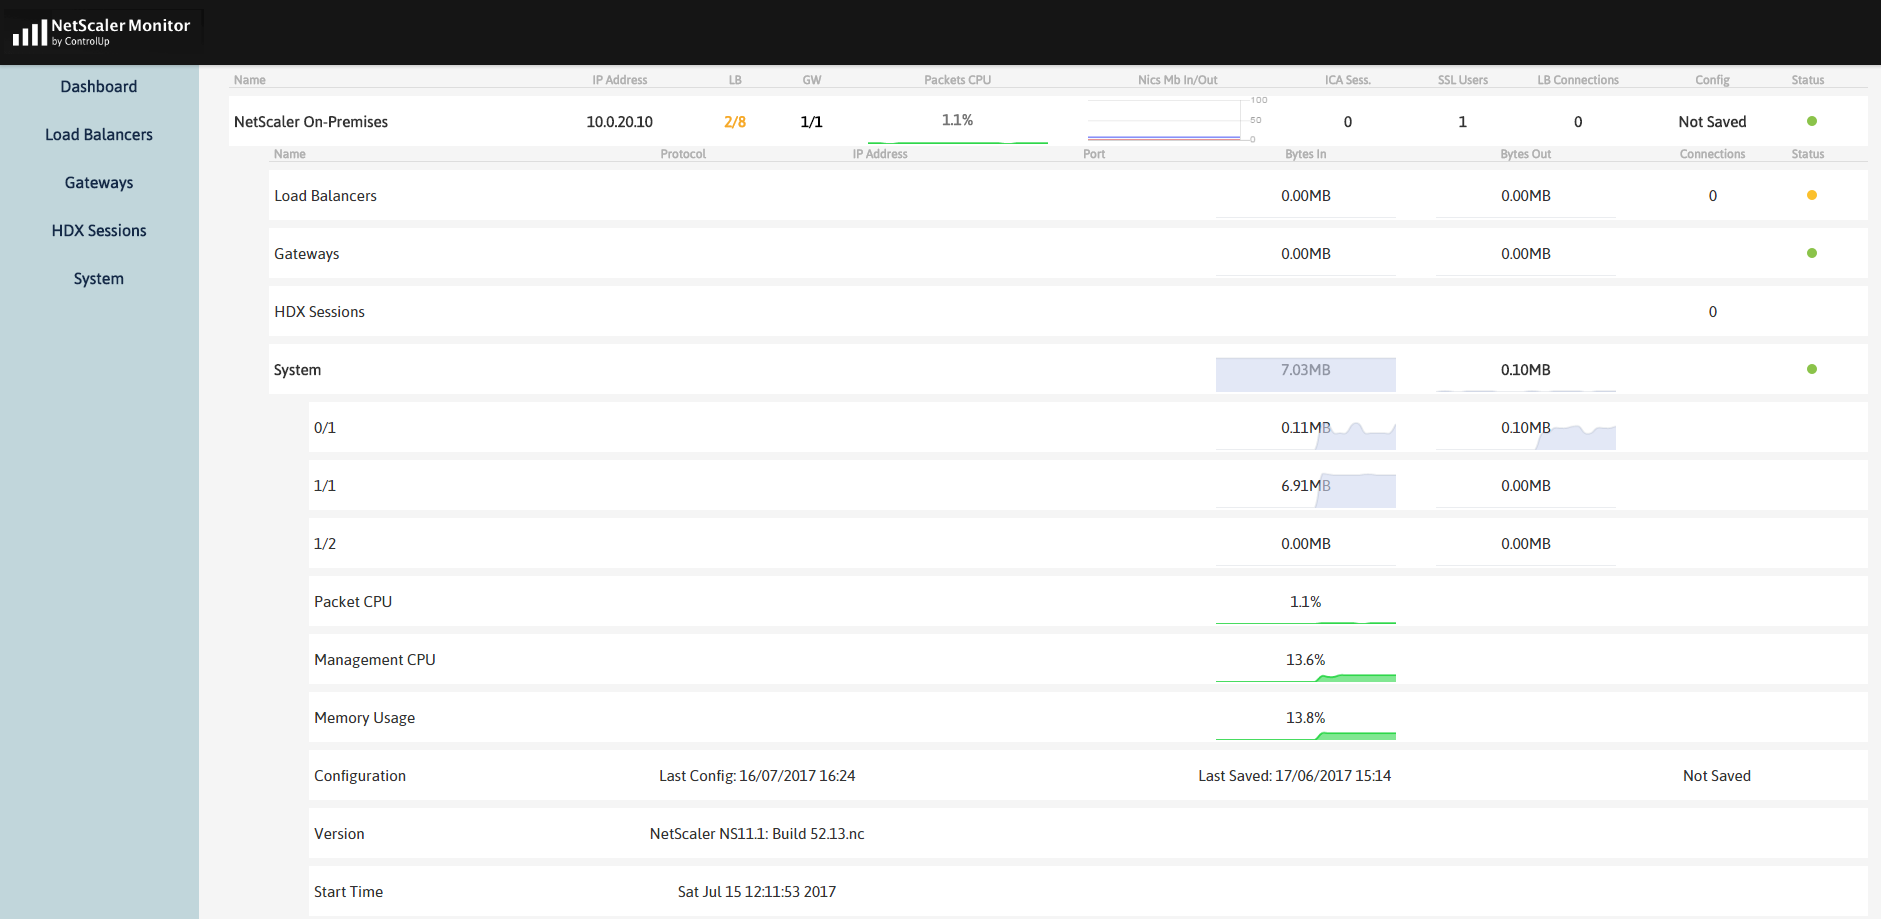
The Dashboard view
Click on the NetScaler in the Dashboard menu option, to show the overall statistics of the NetScaler. Here you can see the number of Load Balancers, VPN vServers, CPU utilization, Network traffic utilization, number of active ICA (HDX) sessions, number of active SSL sessions, number of open connections to LB vServers, the (last) saved config status (useful to check before you perform a reboot!) and the uptime status
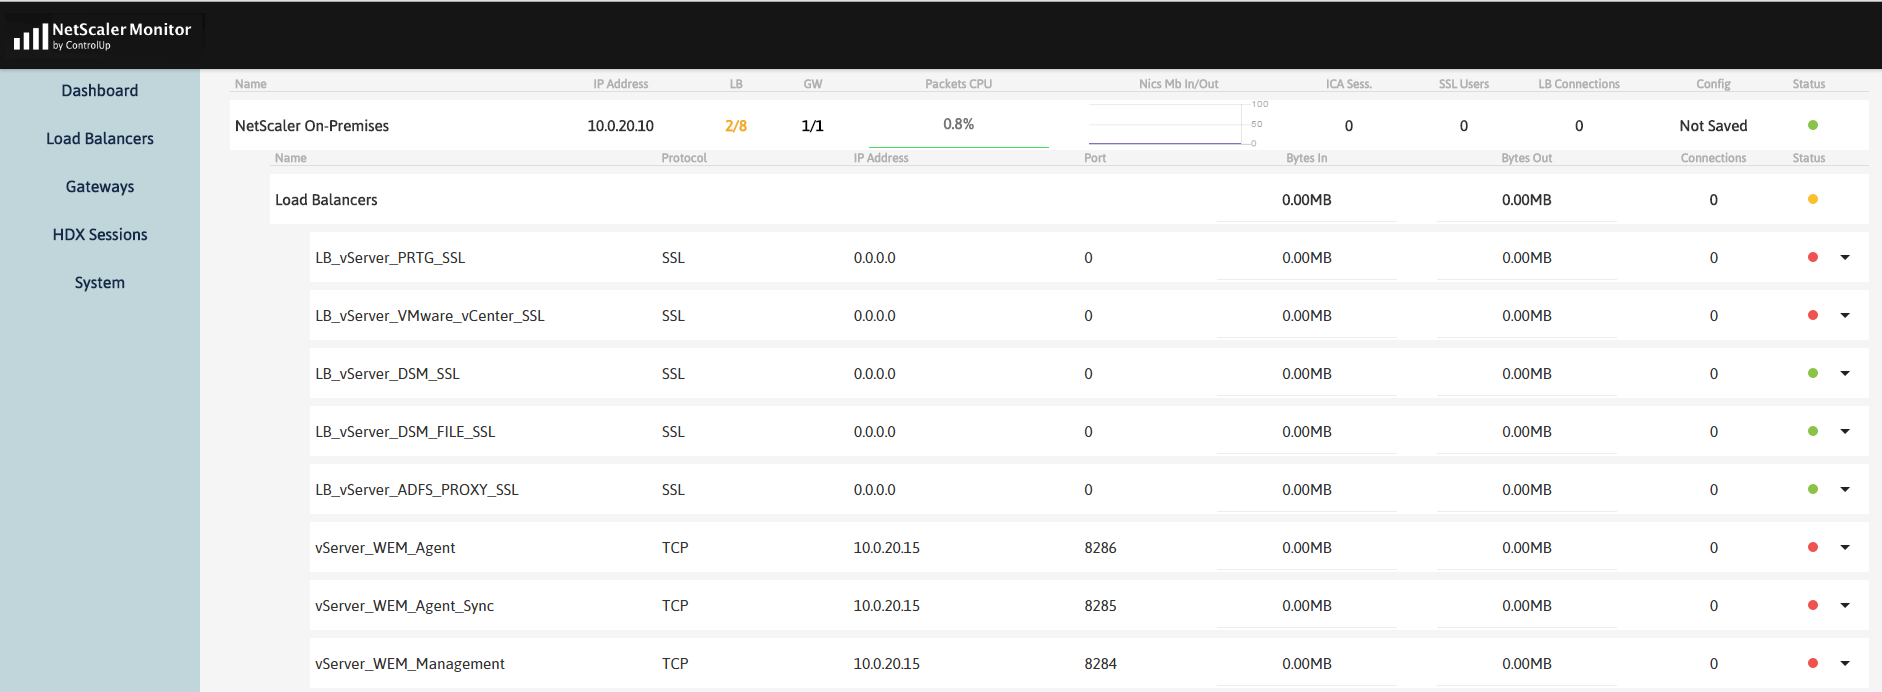
Load balancers status
Click on the Load Balancers option to show all the configured vServers for that specific NetScaler
Monitor ICA sessions
Click on the HDX sessions to see who is connected through ICA Proxy on the NetScaler Device. There is even a search option to find a user session more easier when 100+ sessions are connected.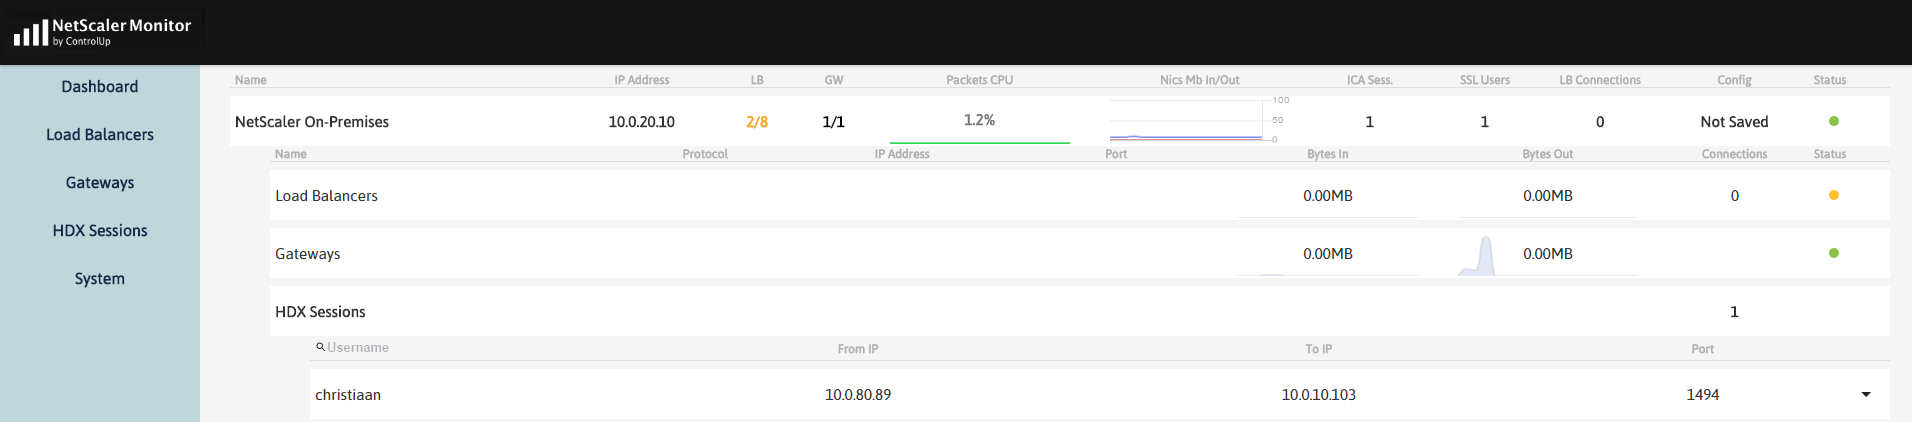
Detailed system status
The System option shows us detailed information about the NetScaler device information, such as the Network Interfaces, CPU usage, RAM consumption and boot information are all listed here.
Summary
You can see some interesting information, just to determinate if the problems are related the NetScaler device or something else is causing this. In fact, this can also be handful to be showed on a LCD monitor in your IT departments room, just to do a quick check if something is wrong.